Like the phyllotaxis spiral, a nice mathematical figure to draw in code is the sequence of Ford Circles.
A while back I tried generating these using Fathom and Processing - now for fun I've tried them in JavaScript. A page to play with them is here, and the source code is in a Github repo.
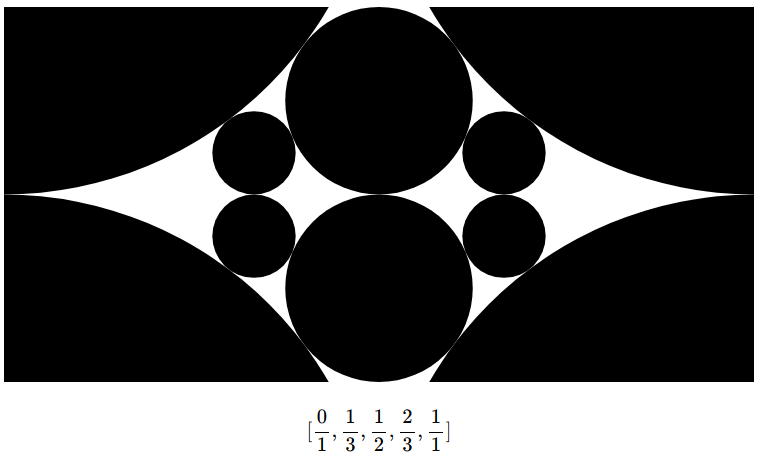
On the page, you can control the level of the Farey sequence used to generate the circles - you start off with just 0 and 1:

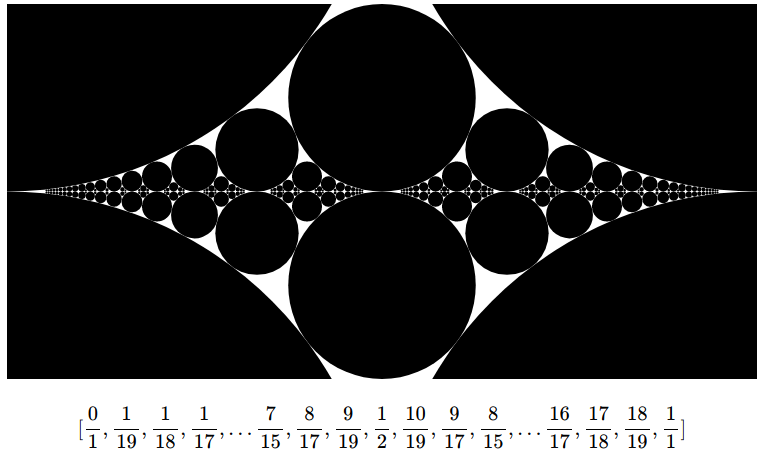
Using the buttons provided, you can increase the number of terms in the sequence and the corresponding number of circles.
After a certain point, the page does not list the entire sequence associated with the circles.
Update - Ford Circles in Desmos
It's also a nice exercise to create Ford circles using Desmos - here is an example of a graph that does this.
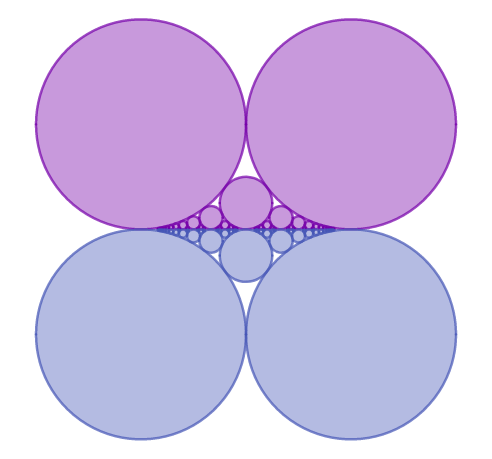
Some Ford Circles in Desmos
Just as with implementing the JavaScript, getting this to work in Desmos first involves creating some fractions, then finding which fractions to include in the Farey sequence, and then drawing circles using the elements of that sequence. The steps that this graph follows are basically:
- create an mxm set N of numbers (n,d), where n and d are integers 1...m.
- shift and reduce this set of ordered pairs so that in any given row, 0 <= n < d+1.
- reduce this set further eliminating any ordered pairs where gcd(n,d) > 1.
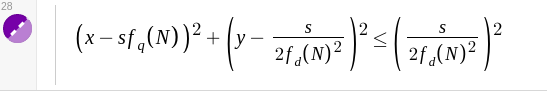
These ordered pairs can be treated as fractions (n/d), and we will only have fractions between 0 and 1 that are in reduced form - if we then order these fractions along the number line, we have a 'Farey sequence' of fractions. In this, we didn't use the recursive approach used in the JavaScript example that uses the mediant. Drawing the circles uses the same formula used in the JavaScript example (and the Processing and Fathom examples mentioned above).