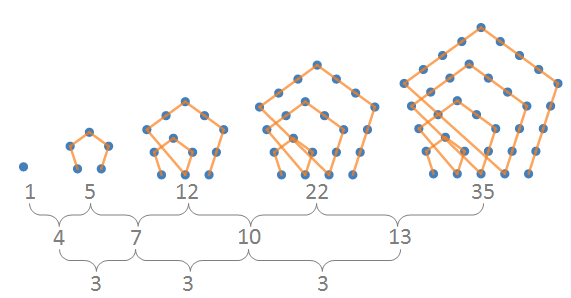
Polygonal numbers are a favorite topic in recreational math and there are quite a few posts about them on this blog (such as this one, here). The image above hints at some of their interest: polygonal numbers, like the pentagonals shown above have numerical properties that translate nicely into visual properties in their associated diagrams.
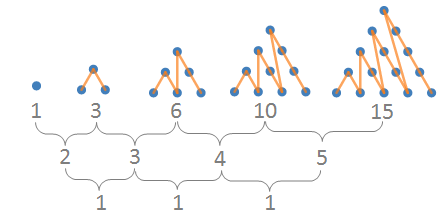
The first few triangular number diagrams

Some examples from the polygonal
number graph
number graph
If the n dots form a complete diagram, that means that n is a k-polygonal number. So this graph will draw partial diagrams. For example, you can draw a square with 9 dots, so it's a square number, but you can't draw a square with 10 dots, so it is not a square number. You can draw a hexagon with 15 dots, so it's hexagonal, but you cannot do the same with 26.
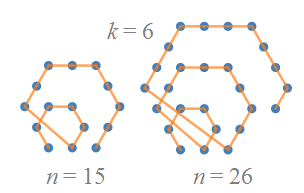
15 is hexagonal, 26 is not
To understand the formulas, or come up with your own, you need to be aware of the rules for how to form polygonal diagrams, which are based on the idea of adding a layer of points (called a gnomon) to the previous k-polygonal number to get the current k-polygonal number. Using the graph, you can likely figure out the rule how many dots will be in each gnomon for a given layer and k value.

pentagonal 12, gnomons
shown on right
shown on right

81 is the sixth heptagonal number:
there are 5 gnomons (of 5 sides each) layered on
top of 1 to make 81
there are 5 gnomons (of 5 sides each) layered on
top of 1 to make 81
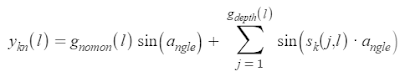
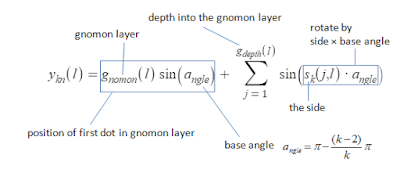
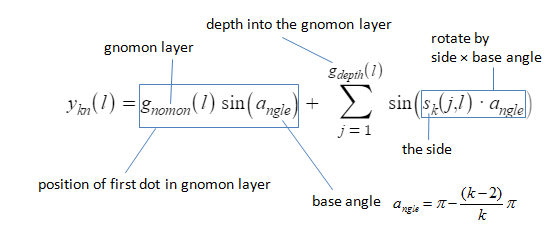
The way I chose to draw these was that for a given number n, you determine which gnomon layer it lies in, how far along the gnomon layer it is, and what side of the gnomon it is on. The gnomon layer for n tells us where to start: we just need to count up to the layer along angle that is determined by k. If we know how far along in the layer it is, we know how many dots to move along before plotting our point. And finally, if we know which side it is on, we know how many turns to make along the way.
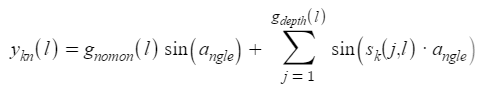
So for example, the formula for the y coordinate is this:
Applying the explanation above, you may get a sense of how it works:
 Built into this there is a little more complexity: one method of finding out the gnomon layer we are in is to use a formula for computing polygonal numbers along with the quadratic formula (found in the polygonal number formula calculations section of the graph).
When I've written little programs to draw polygonal numbers before (like in the Fathom/Tinkerplots version), I relied heavily on conditional statements (if/else) and on iteration/recursion (use of the prev() function). It was a challenge for me to take something that relied on those sort of programming constructs and translate it into an extreme function-oriented environment like Desmos. It was revealing to see how conditionals became products of 'truth functions' (returning 0 or 1), and how iterations were replaced by sums.
So for example, the formula for the y coordinate is this:
Applying the explanation above, you may get a sense of how it works:
When I've written little programs to draw polygonal numbers before (like in the Fathom/Tinkerplots version), I relied heavily on conditional statements (if/else) and on iteration/recursion (use of the prev() function). It was a challenge for me to take something that relied on those sort of programming constructs and translate it into an extreme function-oriented environment like Desmos. It was revealing to see how conditionals became products of 'truth functions' (returning 0 or 1), and how iterations were replaced by sums.