 Looking at the last few digits that appear in the numbers that form the sequence b^0, b^1, b^2, b^3, ... for b a positive integer, you'll notice that the digits will always begin to repeat after a certain point. For example, looking at the last digit of the sequences for b = 2, 3, and 4 we have the sequences
b = 2: 1, 2, 4, 8, 6, 2, 4, 8, 6, ...
b = 3: 1, 3, 9, 7, 1, 3, 9, 7, ...
b = 4: 1, 4, 6, 4, 6, 4, 6, ...
If we look at the sequence of last two digits of these sequence where b =2 we have
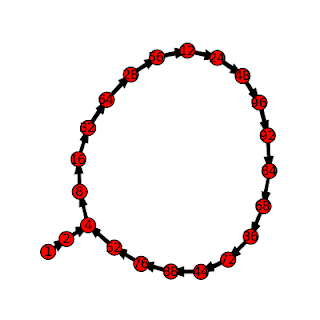
b = 2: 1, 2, 4, 8, 16, 32, 64, 28, 56, 12, 24, 48, 96, 92, 84, 68, 36, 72, 44, 88, 76, 52, 4, ...
This sequence then repeats the loop that began at 4.
We can describe these sequences as T_b,d(n) = (b^n)mod 10^d. Recursively, T_b,d(n) = (T_b,d(n-1)*b)mod 10^d
These sequences are always eventually periodic. Although these sequences are simple to understand and calculate, there are several interesting ways of describing them.
For example, you can think of the elements of T_b,d as a commutative monoid, with multiplication defined as a*b = (a*b)mod 10^d. They form a monoid since 1 is always a member, and you can show that T_b,d is closed under the * operation. It turns out that for some values of b, and d, T_b,d is a group.
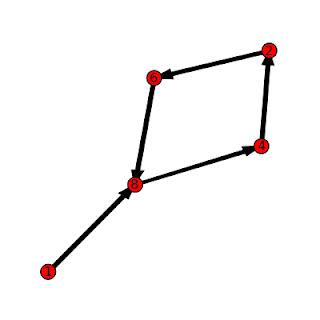
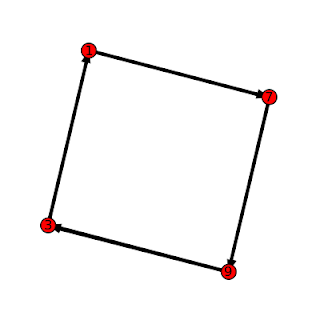
You can also think of this set as a finite state machine or graph, where each element is a node and the transition from one node to the next is defined by the operation *b mod 10^d. This provides a nice way of displaying the sequences. The pictures in this post were created by writing a short program to calculate the sequences, and then formatting the output to draw a di-graph in SAGE. The graph at the top of the post is for b=8, d=1, while the graph below is for b=2, d=2. The graph at the bottom of the page is for b=7, d=1.

