Thursday, May 9, 2019

star polygon fun

Star and compound polygons are pretty mathematical objects that are fun to draw or create in code.
star and compound polygons
on 2 to 9 vertices

You might draw ten pointed polygons while exploring the multiplication table, for example. In the picture below, skip counting by 6 while drawing a line between the last digits of consecutive numbers gives us a pentagon: counting 0, 6, 12, 18, 24, 30 we draw lines connecting 0, 6, 2, 8, 4, and 0.

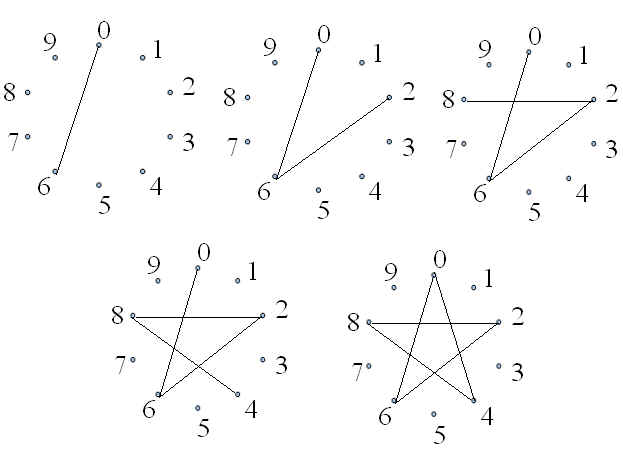
skip counting by 6 draws {5/2}

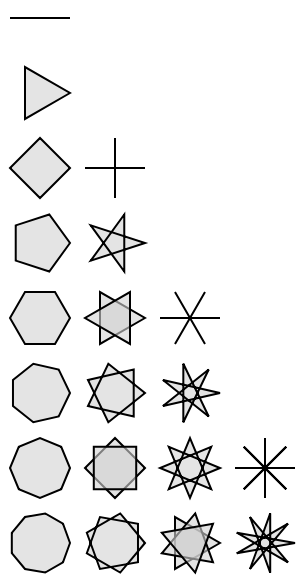
When drawing star and compound polygons by hand, you start with n points spaced evenly around a circle, and then from each point connect to another, always skipping over the same number of points. If you skip over 0 points, you get the regular n-gon. If you skip over k points, and k+1 is relatively prime with n, you will get a star polygon, if n and k+1 share factors, you get a compound of several regular or star polygons.

On 9 points, skipping over 0, 1, 2, and 3
vertices

It is interesting how an easy to describe algorithm like this, skipping around points on a circle, translates into a program.

The polygons on this page are drawn using some JavaScript (code here), which includes some use of trig functions to place the initial vertices (like points around a unit circle) and modular arithmetic to help traverse the list of points in a circular way. It's a nice example of how math makes its way into how we implement even simple algorithms.

When we go fully over to a mathematical way of expressing how to draw these by using desmos, we can see how mathematics can, in this case, express the algorithm in a surprisingly compact way. You can check out the graph here.

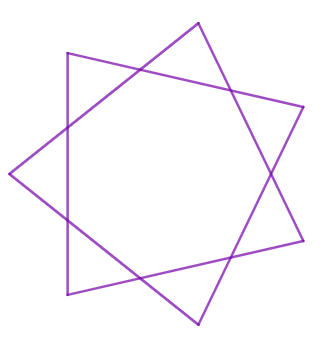
desmos sketch of {7/2},
graph here


Related links and posts
star polygon page
star polygons in desmos
polygons in the multiplication table

Wednesday, May 8, 2019

Desmos Chladni

Like Lissajous figures, Chladni figures provide a surprising and aesthetically engaging example of wave interaction.

Named for Ernst Chladni, these figures represent nodal patterns formed by vibrating surfaces. Traditionally, these are formed placing fine particles on a surface, like a sheet of metal that is set vibrating (a violin bow against an edge of the metal plate is one popular method). The particles settle in the areas of the surface that have the least motion - the nodes. When you achieve a resonant frequency, a characteristic pattern emerges.

In past posts I've pointed to code that draws Chladni figures using R (here and here), and using JavaScript. Maybe not surprisingly, you can also play around with Chladni-like figures using Desmos, and this may be the most accessible way to explore them them and appreciate how they are generated from the sinusoidal functions.

Chladni-like figure generated in R

Chladni-like figure generated using JavaScript


In Desmos, you can create images similar to these using inequalities. The equations are reasonably straight forward - the graph here will draw the figure across the whole plane - best results are seen when zooming in on a small region.

Chladni-like figure generated in Desmos,
graph here


More Chladni-like figures in Desmos

Try playing around with the desmos graph here, R scripts for generating figures are found here, the JavaScript Chladni generating page is here.

Update
After posting on Twitter, the desmos sketches were improved by   and @PaulaKrieg. Here are some other graphs inspired by their changes:

A Chladni-like pattern with
two distinct inequalities

A Chladni-like pattern with three distinct
inequalities

With the added layers, the Chladni patterns are approaching an abstract William Morris appearance.

Another Update
This other graph allows you to experiment more directly with the Chladni figures, similar to the web page mentioned above.

graph for building 
Chladni figures