Tuesday, November 29, 2016

polynomial grid division examples

There are not enough examples of polynomial division using the grid method out there. To remedy that, I have posted about 100 billion examples for your viewing pleasure. Please check ‘em out: https://dmackinnon1.github.io/polygrid/

Jokes aside, I was looking for a small JavaScript project, and this one looked like it would be fun. It was, and I learned a few things by building it. The page will generate a small number of examples, but you can get a fresh batch by reloading. Each example is calculated on the fly, and rendered using MathJax. Currently, the displayed calculations look like this:


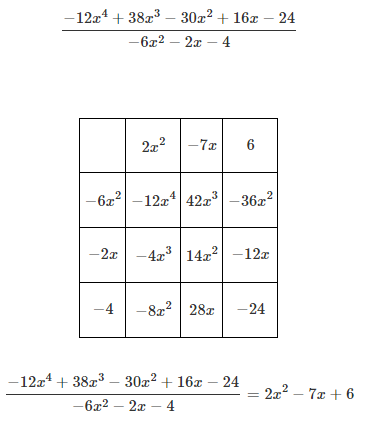
About half the time the examples have remainders, and the calculations vary in length and complexity in no particular order, so if you get a crop of examples that look too intimidating, or too easy, just keep trying and you should get ones more to your liking. If you see one you like, you should copy it down: you may never see it again.

I have plans to make the examples configurable and to show each part of the calculation step by step, but I may not get around to doing that for a while.

Please let me know if you get some use out of this page, particularly if you run into any trouble with it. 

Overviews of how to carry out the grid method, also called the generic rectangle method or the reverse tabular method, can be found here and here. The page does not currently provide any ‘backwards reverse tabular’ calculations, as described here.

Update: The page now allows you to choose if you want remainders or not, and does try to show some of the steps in the calculation.

Friday, November 18, 2016

Desmos polygonal number diagrams


Polygonal numbers are a favorite topic in recreational math and there are quite a few posts about them on this blog (such as this one, here). The image above hints at some of their interest: polygonal numbers, like the pentagonals shown above have numerical properties that translate nicely into visual properties in their associated diagrams.

The very first post of this blog had some instructions for how to generate polygonal number diagrams using Fathom or Tinkerplots (two dynamic data environments; their successor CODAP seems to have the same capabilities), so attempting to do the same in Demos seemed like a good idea.

The first few triangular number diagrams

You can play with the graph here. With it you can choose an n and k value which will plot (x, y) values that will form an n-dot k-polygonal number diagram, with or without the connecting lines.

Some examples from the polygonal
number graph

If the dots form a complete diagram, that means that n is a k-polygonal number. So this graph will draw partial diagrams. For example, you can draw a square with 9 dots, so it's a square number, but you can't draw a square with 10 dots, so it is not a square number. You can draw a hexagon with 15 dots, so it's hexagonal, but you cannot do the same with 26.

15 is hexagonal, 26 is not

To understand the formulas, or come up with your own, you need to be aware of the rules for how to form polygonal diagrams, which are based on the idea of adding a layer of points (called a gnomon) to the previous k-polygonal number to get the current k-polygonal number. Using the graph, you can likely figure out the rule how many dots will be in each gnomon for a given layer and k value.

pentagonal 12, gnomons
shown on right


81 is the sixth heptagonal number: 
there are 5 gnomons (of 5 sides each) layered on 
top of 1 to make 81


The way I chose to draw these was that for a given number n, you determine which gnomon layer it lies in, how far along the gnomon layer it is, and what side of the gnomon it is on. The gnomon layer for n tells us where to start: we just need to count up to the layer along angle that is determined by k. If we know how far along in the layer it is, we know how many dots to move along before plotting our point. And finally, if we know which side it is on, we know how many turns to make along the way.

So for example, the formula for the y coordinate is this:


Applying the explanation above, you may get a sense of how it works:

Built into this there is a little more complexity: one method of finding out the gnomon layer we are in is to use a formula for computing polygonal numbers along with the quadratic formula (found in the polygonal number formula calculations section of the graph).

When I've written little programs to draw polygonal numbers before (like in the Fathom/Tinkerplots version), I relied heavily on conditional statements (if/else) and on iteration/recursion (use of the prev() function). It was a challenge for me to take something that relied on those sort of programming constructs and translate it into an extreme function-oriented environment like Desmos. It was revealing to see how conditionals became products of 'truth functions' (returning 0 or 1), and how iterations were replaced by sums.