Friday, October 28, 2016

doodling with Froebel

Maybe it is time to unplug, put that graphing calculator aside, lay out some graph paper, and pick up a pencil. But what to do? The tyranny of the blank page plagues not only writers, but doodlers as well.

A great source of inspiration for how to fill that graph paper are nineteenth century Froebelian kindergarten text books. Froebel proposed a curriculum based on manipulating and creating using basic forms, realized in the form of "gifts" that were provided to students at various stages of their learning. The gifts were blocks, sticks, squares of paper, drawing tablets and other objects that were used to build, weave, cut, fold, and draw combinations of basic forms. Some old textbooks include nice illustrations of how the gifts were used. For example, the seventh gift was "parquetry tablets," very much like the pattern blocks that are found in many classrooms. The illustrations for these provide some nice inspiration for what you can do when presented with a blank sheet of graph paper.

These illustrations, showing the richness of what can be done with the 45-90 triangle, are from The Kindergarten Guide: An Illustrated Hand-book, Designed for the Self-instruction of Kindergartners, Mothers, and Nurses (1877), by Maria Kraus-Boelte (on google books, here).


The similar set below are taken from The Paradise of Childhood: A Manual for Self-instruction in Friedrich Froebel's Educational Principles, and a Practical Guide to Kinder-gartners (1869), by Edward Wiebe (on google books here).


For example, starting with motif 72/232, I found one way to fill the page.

a pattern based on motif 72/232

Of course, it wasn't long before I felt compelled to re-create it using some dynamic geometry software (GSP):

As you get into the flow, a host of associations and observations may come to mind. One thing I noticed about this pattern was that the gaps look like something you would make from an origami windmill base (almost a pajarita or cocotte, a popular "European" origami model). Not all things that pop into your head at this point are legitimate observations, of course, and upon investigation I found that the gaps are not quite a proper pajarita:


the pajarita

But seeing origami birds flying around in that pattern seems appropriate: the eighteenth Froebelian gift was folding papers, which were used to explore patterns that could be obtained from the windmill base:

Some Froebelian forms from origami
windmill base (from 
Origami Spirit)

Back to doodling, I tried another variation using the same basic motif:

another pattern based 
on motif 72/232


Is it just a coincidence that the gaps in both patterns have the same area? Maybe, but there must be a minimal gap for any pattern based on this motif, perhaps three squares is what it is (more doodling required).

gaps in patterns based on 72/232 have the
same total area, maybe

I have to put this aside now, but you should get started. Here are a few more panels from The Paradise of Childhood that might inspire some grid paper doodles:


Tuesday, October 25, 2016

notes for a spirolateral bestiary

The simple rules for creating generalized spirolaterals produce a surprisingly diverse menagerie of paths which trace out some familiar and less-familiar shapes, including regular polygons, star polygons, tangles, wreaths and infinitely long springs.

some spirolaterals (graph here)

In the formula below, a represents the angle that you turn by at each step, and m represents the maximum length of the sides that you count up to before repeating. If m = 1, all sides are length 1, if m = 2, then the sides alternate between length 1 and length 2, for m = 3, the lengths of the sides form the repeating squence 1, 2, 3, 1, 2, 3... etc.
If the angle that you turn by is a rational multiple of 2pi, then the first spirolateral (m = 1) will trace out either a regular polygon or a regular star polygon - it is always adding a length of 1, and since the angle is a multiple of 2pi you will close the loop and end up back where you started.
Different story if the angle not a rational multiple of 2pi: you will never get back to the starting point, and the first spirolateral is going to look like an annulus after enough iterations (below is a = 2, zoomed in on the left, zoomed out on the right):

spirolateral that does not (soon) meet up - graph here

For higher values of m, although the shapes traced out vary widely they are always equiangular (we are always turning by the same angle, after all). So for m = 2 we end up with isogonal figures: every vertex is the same - it always has the same angle and always has sides of lengths 1 and 2 on either side of it. Here are some isogonal polygons - the first, the rectangle, is pretty familiar; the second, @solvemymaths tells us, may be a ditrigon.

And here are a few star-isogonals:

What about the beasties that spiral off to infinity? One set of these springs occur when a = pi/k for some positive integer k  and m = 2k.


And then there are the tangled stars... not sure where to begin with these.

Trying classify even a few of these strange creatures reminds me of Borges' Book of Imaginary Beings.

Thursday, October 20, 2016

more familiar spirals in Desmos: spirolaterals

After the last post about how to draw some types of spirals using Desmos, I was pointed to a treasure trove of spiral and Desmos goodness in the twitter microblogging of @Veganmathbeagle and @GHSMaths. I haven't yet had the chance to dig too deeply yet, but looking forward to it.

Also, @Desmos kindly improved upon one set of spirals: the "polygonal numbers on quadratic spiral" family, showing how to connect the dots and link up the points of the spiral (the improved graph is here). The technique: use the functions for x and y to create a family of parametrically defined line segments. To create a line segment between two points A and B, you can introduce a parameter t which moves you from A to B as t varies from 0 to 1, applying this idea to pairs of points on the graph allows you to connect up the discrete points.
parametric formula for line segment AB

Armed with this, I'm adding one more group of spirals to the list: spirolaterals.

Spirolaterals

Spirolaterals are easily drawn by hand by following this simple rule: draw line segments starting at 1 unit long and going up to n units long, turning 90 degrees between each segment, and then repeating the process from 1 again.

The first spirolateral traces out a square: move 1 space, turn 90 degrees, move 1 space, turn 90 degrees, move 1 space, turn 90 degrees,... you get the idea. The second spirolatoral yields a rectangle: move 1 space, turn 90 degrees, move 2 spaces, turn 90 degrees, move 1 space, turn 90 degrees, move 2 spaces, turn 90 degrees.... Maybe not so fascinating, but the third spiral gives an interesting shape of 4 rotated rectangles, and the fifth spirals off the page like an uncoiling spring.

I learned about spirolaterals from The Puzzle Universe (review here). The definition did not, to me at least, look like something easily expressed using equations. At the time I wrote a little Processing program to draw them:

some spirolaterals for small m values

If you are of a certain age, these might remind you of something you might draw in LOGO (Turtle graphics). But can you do it in Desmos? Yes you can. Here is one way to express the nth step of the mth spirolateral:


spirolateral 19 in Desmos graph here

Is this an efficient way of drawing spirolaterals? Maybe not: at each step you are effectively re-tracing the whole length of the spiral (the sum does this). But what I think is cool is that it can be done at all. In this case, something that you might think requires programming constructs (a loop, some temporary variables), can be compressed into simple equations. Here the key device is the modulo function (actually modulo plus 1), which ensures that you keep repeating the sequence 1 to m as you step around the spiral.

Other angles

I know what you want to do: you want to change the rules. Ok, one thing to try is to not to turn at a 90 degree angle, but some other angle: each choice of an angle gives a new family of spirolaterals.


spirolaterals based on 60 degree turns (graph here)


spirolaterals based on a 144 degree angle (graph here)

A general graph that has sliders to allow you to play with the angles is here.

Spirolaterals are a lot like the Euler spirals mentioned in the previous post. In a way, they are almost dual to those - Euler spirals keep the same magnitude for each step but keep increasing the angle that they turn by at each step, while spirolaterals keep the same angle but keep increasing the magnitude of each step (up to a limit, after which they repeat). Here is an improved version of the Euler spiral graph, this time with connecting lines.

Euler spiral (graph here)

Thursday, October 13, 2016

some familiar spirals in Desmos

I am revisiting some favorite spirals, plotting them in Desmos - for each below, try following the link to play with the graph yourself.
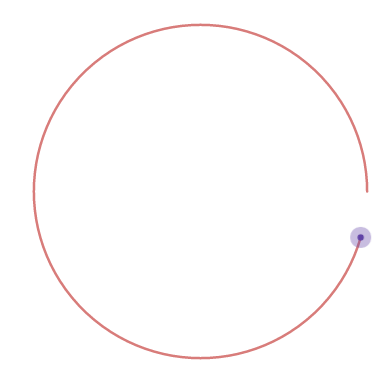
start with a circle

The basic approach to drawing these spirals (and other things, like these curves), is to start with a circle defined using parametric equations. (graph here)


By playing with this simple equation, often by just adjusting the r and t values, we can make a number of spirals. In many cases we are going to make spirals out of points, so we'll just be replacing r and t with integer sequences.

Phyllotaxis-ish spirals

These spirals are easy to create, and are a perennial favorite (pun intended: the sunflower connection). I've plotted these in Fathom/Tinkerplots, Processing, and more recently in R (its not only for stats, just mostly). If you haven't plotted these yet in your favorite graphical programming environment, you should.

The Desmos version animates nicely - you can grow and shrink the spiral, and play with the angle at the same time.

Some phyllotaxis-like spirals (graph here)

To create these, take the basic equation mentioned with this definition for the two sequences


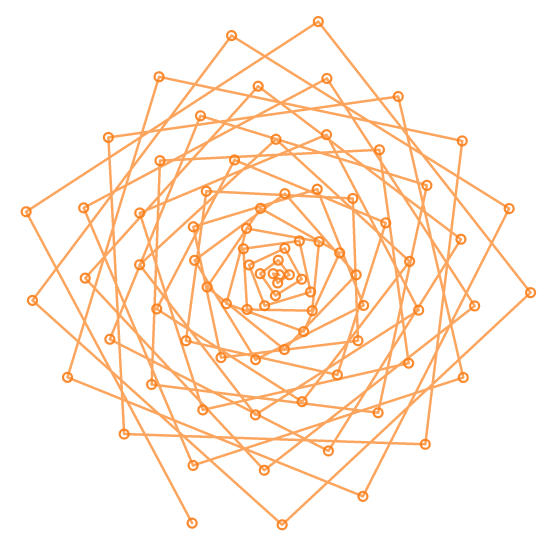
Quadratic number spirals
I first saw quadratic number spirals at numberspiral.com. A quadratic spiral also fits into the basic spiral form mentioned above (graph here)/


It doesn't look much like a spiral, but you can see that it is when you connect the dots.

plain ol' quadratic spiral (graph here)

With every element in the sequences included, this spiral does not look so interesting. But we can "plot" another integer sequence on top of the spiral, some interesting patterns can emerge.


Primes on quadratic number spiral
numberspiral.com discusses the interesting patterns that seem to show up when you plot the prime numbers on the number spiral. You get an effect similar to the better-known Ulam spiral - the primes seem to cluster and line up along certain trajectories. What you are really seeing are certain prime producing quadratics, not a set of patterns that holds generally for primes. (Other number spiral fun here).

In Desmos, you can paste in a list of primes and plot them nicely on the spiral. I went up to 201 primes:

p = [2, 3, 5, 7, 11, 13, 17, 19, 23, 29, 31, 37, 41, 43, 47, 53, 59, 61, 67, 71, 73, 79, 83, 89, 97, 101, 103, 107, 109, 113, 127, 131, 137, 139, 149, 151, 157, 163, 167, 173, 179, 181, 191, 193, 197, 199, 211, 223, 227, 229, 233, 239, 241, 251, 257, 263, 269, 271, 277, 281, 283, 293, 307, 311, 313, 317, 331, 337, 347, 349, 353, 359, 367, 373, 379, 383, 389, 397, 401, 409, 419, 421, 431, 433, 439, 443, 449, 457, 461, 463, 467, 479, 487, 491, 499, 503, 509, 521, 523, 541, 547, 557, 563, 569, 571, 577, 587, 593, 599, 601, 607, 613, 617, 619, 631, 641, 643, 647, 653, 659, 661, 673, 677, 683, 691, 701, 709, 719, 727, 733, 739, 743, 751, 757, 761, 769, 773, 787, 797, 809, 811, 821, 823, 827, 829, 839, 853, 857, 859, 863, 877, 881, 883, 887, 907, 911, 919, 929, 937, 941, 947, 953, 967, 971, 977, 983, 991, 997, 1009, 1013, 1019, 1021, 1031, 1033, 1039, 1049, 1051, 1061, 1063, 1069, 1087, 1091, 1093, 1097, 1103, 1109, 1117, 1123, 1129, 1151, 1153, 1163, 1171, 1181, 1187, 1193, 1201, 1213, 1217, 1223, 1229]

We take these and insert them into our existing quadratic spiral formula.

And get this sequence (in blue) shown on top of the full quadratic spiral (graph here).


Can you see those intriguing looking lines of points where the primes seem to line up?

Polygonal numbers on quadratic numbers spiral

If you can plot primes on the number spiral, why not other sequences? A nice family of sequences are the polygonal numbers. You've heard of square numbers (1, 4, 9, ...)? Well, there are triangular, pentagonal, hexagonal, and others, and each number in those sequences can be arranged in a particular way to look like the polygon for which the sequence is named. It's true. One way to define the k-polygonal numbers is:


Those lines above make two interesting statements about polygonal numbers. First, any polygonal number can be broken up into triangular numbers (one big n-sized triangular number, and k-3 smaller triangular numbers). Second, triangular numbers correspond to the second column of Pascal's triangle. Two neat things.

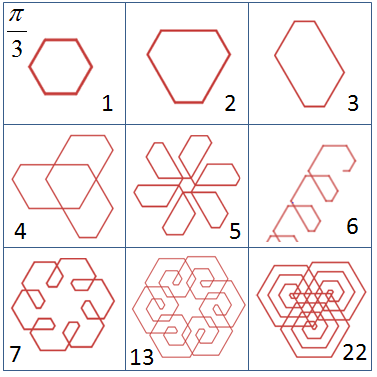
A while back I plotted various polygonal numbers on quadratic spirals. Each type of polygonal number has its own characteristic spiral pattern. Redoing it in Desmos, I took advantage of the combinations function to generate polygonal numbers, and then plot them on the number spiral. To connect the dots, I have found it necessary to convert the plot to a table. Here we have the triangular numbers (= 3):

triangular number spiral (graph here)

This is just from composing the polygonal number formula with the quadratic spiral formula:

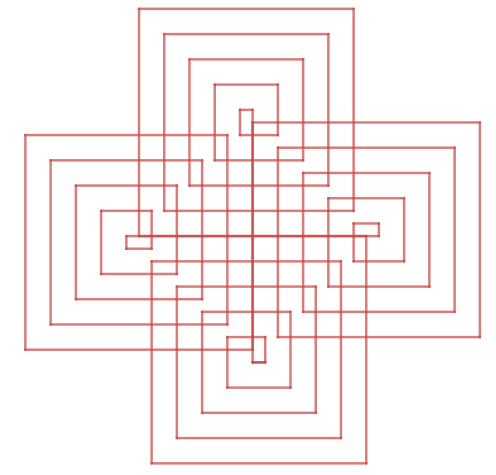
Choosing different values for k gives you different polygonal numbers, and different spirals. For k =12 we get the spiral below:
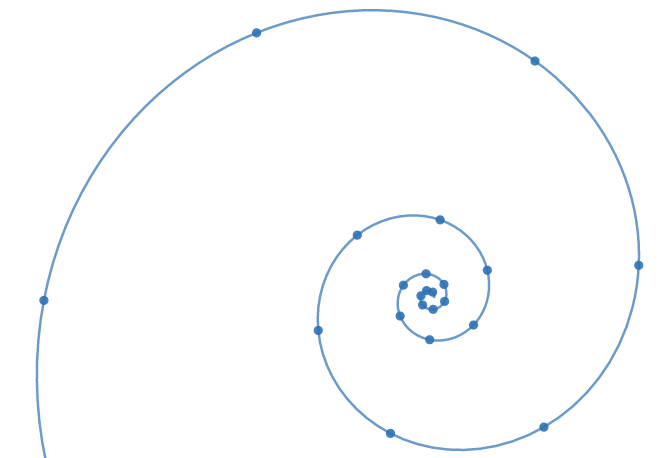
dodecagon number spiral (graph here)


Archimedean spiral
If this post had a logical order, the Archimedian spiral should have probably led off the list.

Archimedian spiral (graph here)

If you are going to try plotting these, you may want to try the variations on the Archimedian spiral mentioned on the wikipedia page.

Logarithmic spiral
Of all the spirals on this page, the one most likely to end up on the "tattoo ideas" pinterest board is the logarithmic spiral. Again, it is a variation on the basic formula:
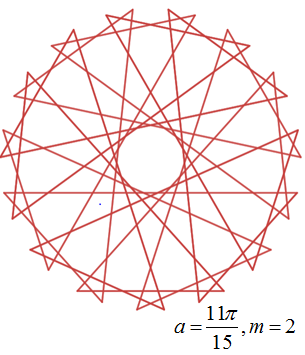
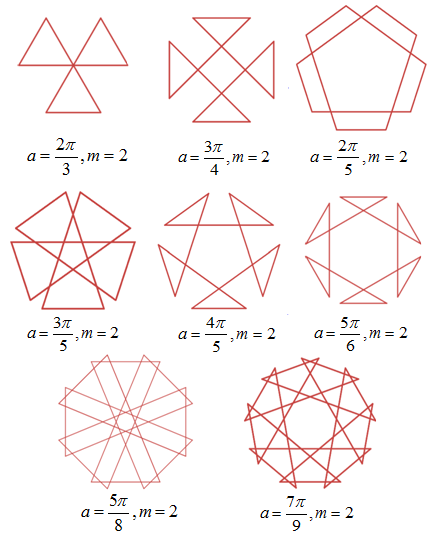
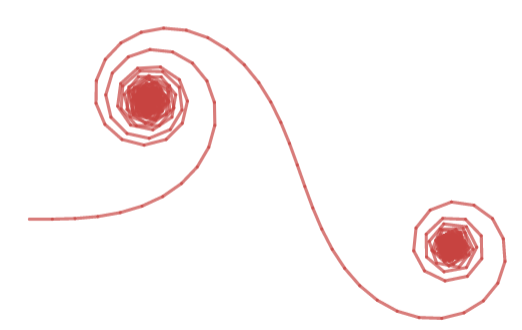
Logarithmic spiral (graph here)


Euler spirals
Let's finish with something weird. Our last spiral of the day will be a family of spirally things known as Euler spirals. An earlier post that describes these spirals is here.

Like the "brain and propeller" curves from 
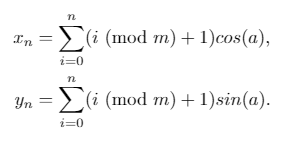
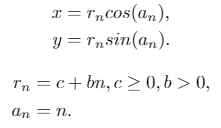
this post, these are also based on the parametric equation of a circle, but not in the same way as the curves listed above. In other software, I had drawn these using a recursive formula. Since I don't know how (if?) this can be done in Desmos, a non-recursive formula was required. For both m and 
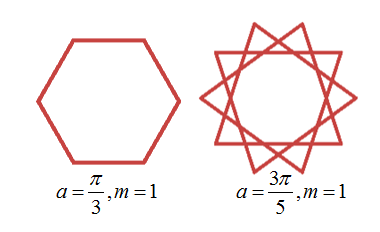
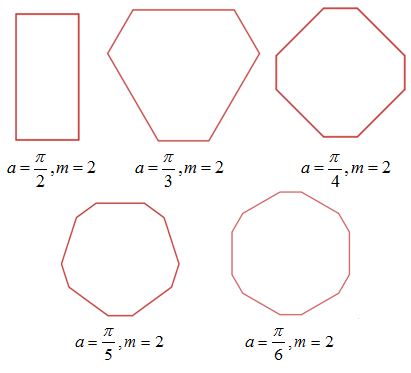
d positive real numbers, we define x and y for each n:


The results are very sensitive to the choice for 
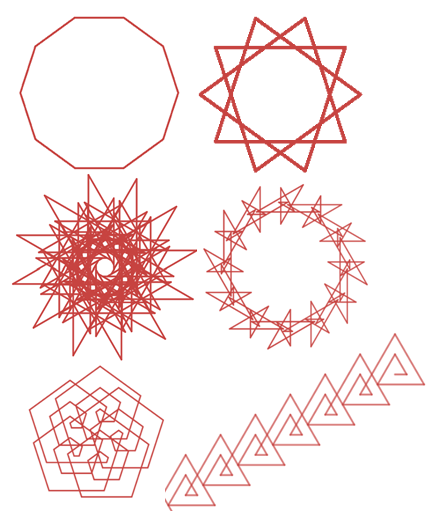
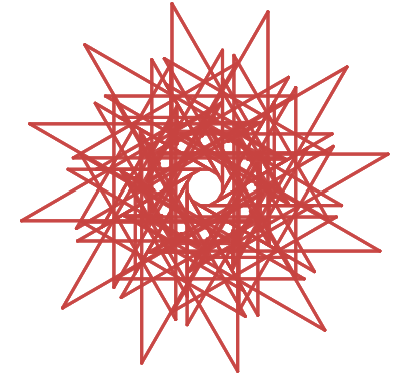
d, and give a menagerie of beasties:

A Euler spiral (graph here)

And some that look like coils of rope, thanks to the overlapping dots:

Eulerian Coils (graph here)


As for the polygonal number spirals above, to connect the dots, I found that I had to choose a particular set value for the plotted points, convert them to a table, and then connect them.

Update: I have since learned how to connect the dots in Desmos, see this post for details.