The two baby R examples here make use of some of the built in math functions in R (sin, cos, and sqrt), and illustrate the vector-based approach that R takes. In R, instead of iterating using a while or for loop and applying functions to individual values, many functions are 'vectorized' so you can provide a whole vector of arguments to a function and it will do the iterating for you. Hopefully you will see what I mean in the examples below.
Example 1: Lissajous figures


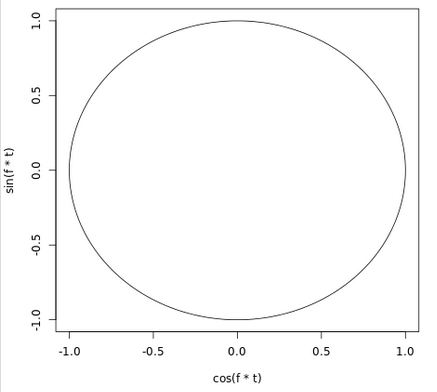


R provides a number of ways of creating vectors - ordered collections of a single data type. One way to create a vector that is just a sequence of the form n, n + 1, n + 2, ... k is to use the colon notation n:k. Here (example 1a) some basic raw input the (vector t) has a scaling factor f applied to it. When you multiply a 'scalar' (actually, in R this is a one-element vector) by a vector, the scalar is applied to each element of the vector (as you might expect) to produce a new vector. Something a bit less expected is that functions like sin() are vectorized - if you provide a vector as an argument, they will produce a vector of the same size as a result, and the contents of the returned vector are what you would expect to get from applying the function to each element.
The plot() function is flexible - when a single vector is provided (example 1a) it will plot the ordered pairs (x, y) using elements of the vector as y values against x values inferred from each element's position in the vector (its index). When two vectors are provided (example 1b), the first vector provides the x values, and the second the y values (generally, R implements some 'recycling' behavior when the two vectors are not of equal length but the length of one is a multiple of the other). Finally, the plot() function offers some additional arguments for formatting the output.
A very different "synthetic" approach to drawing lissajous figures can be taken in Geometer's Sketchpad, as mentioned here.
Example 2: Phyllotaxis spirals


Something that takes getting used to: sqrt(t)*cos(t) is not merely the multiplication of two numbers, it is the position-wise multiplication of two vectors (lists of numbers): t is a vector, sqrt(t) is a vector made up of the square roots of the elements of t, cos(t) is a vector made up of the cosines of the elements of t, and sqrt(t)*cos(t) is a vector made up elements obtained by multiplying the ith element of sqrt(t) by the ith element of cos(t). This is not the normal 'mathematical' way of multiplying vectors, but it is consistently used throughout R to achieve its distinctive vectorized programming model.
There are some older posts on drawing spirals like this in Fathom and Tinkerplots (see here), and also in Processing (see here).
FWIW, these simple examples are on github - maybe more will join them later.